
If two teams pull different “month-end” figures from different files, you don’t have a reporting problem. You have a trust problem. PDT’s analytics work is about making data usable: one place to look, definitions everyone agrees on, and views that match how managers actually run the week.
What we actually build
Data integration
Finance systems, CRMs, Excel exports, operational databases. We map what you have and connect what matters for the questions you ask every week.
Shared definitions
Revenue, active customer, stock-out, attendance. We document calculation rules and exceptions in language your team wrote together.
Dashboards & reports
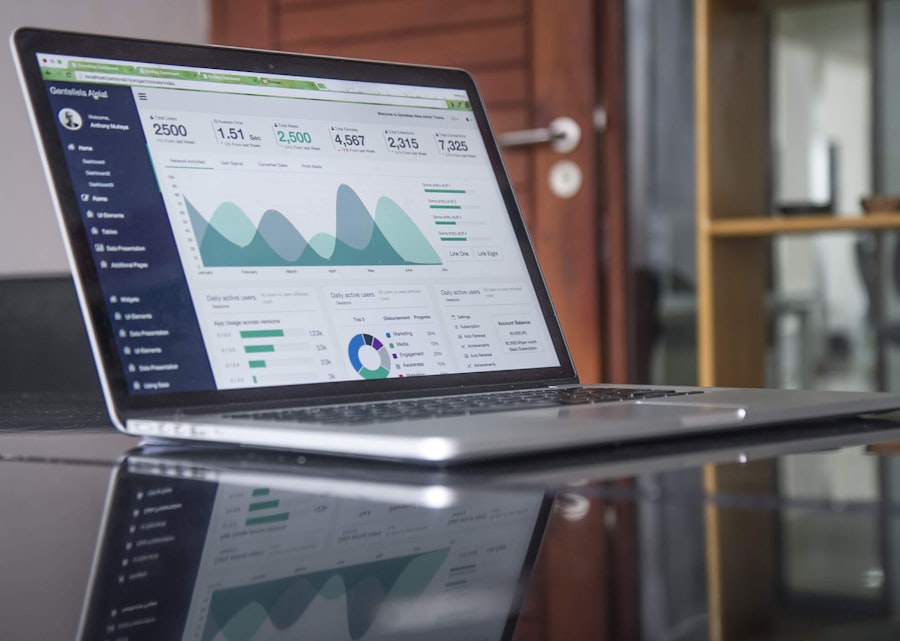
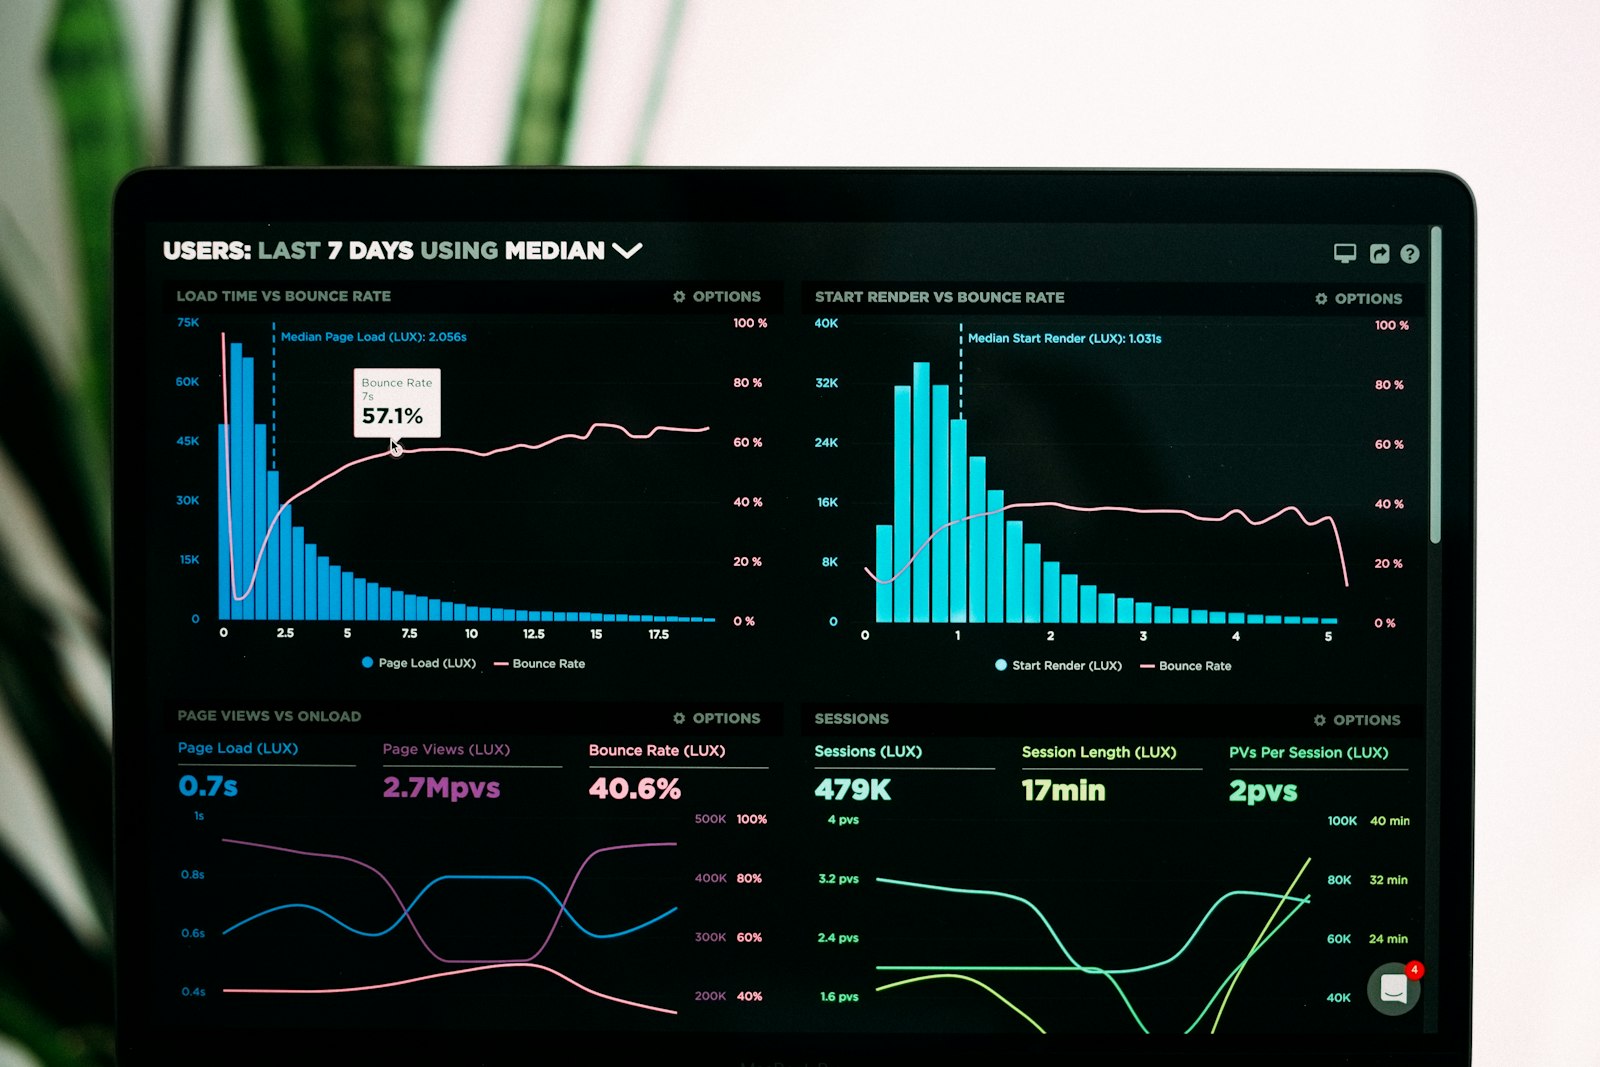
Interactive views and scheduled packs for executives, ops leads, and analysts, each with the right level of detail.
Forecasting
Trend analysis where the data supports it: demand, cash, utilisation, seasonal patterns. We’ll say when a projection is solid and when it’s only directional.
How an analytics project usually runs
Name the questions
We start with the decisions and reports that cause friction, not a wishlist of every chart imaginable.
Map the sources
Inventory ownership, refresh cadence, and quality gaps before building anything fancy.
Agree the metrics
Write down definitions so “month-end” means the same thing in every room.
Ship usable views
Dashboards people open on Monday, plus handover so your team can maintain them.
Where analytics tends to pay off first
One agreed P&L and cash view cuts the meeting time spent reconciling files.
See stock, throughput, or service levels in days, not at month-end when the damage is done.
Pipeline and conversion metrics that match how your team actually sells.
Board packs that answer questions in under a minute instead of decorating a slide.
What you walk away with
- A scoped domain with KPIs you can measure
- Connected sources and scheduled refreshes
- Documented metric definitions
- Role-based dashboards and exportable packs
- Training so your team can extend views without calling us every time
Common questions
Do you only work with big data platforms?
No. Many clients start with Excel, SQL databases, and a BI tool. We match the stack to the size of the problem, then grow it when needed.
Can you train our team to maintain dashboards?
Yes. Handing over ownership is part of the job. We document refresh steps and leave you with people who can extend views.
How long does a first dashboard take?
A focused pilot (one domain, a few core KPIs) is often weeks, not months, if data access is ready. Broader rollouts take longer and we phase them.
Ready to clean up the numbers?
Share which report or KPI causes the most friction. We’ll outline a practical path from messy inputs to something your leadership can trust.
Discuss analytics